Last month, I discussed the importance of using multiple tools when gauging the success of your automotive SEO efforts. Simply looking at a graph on Google Analytics won’t tell you much; in fact, doing so can be misleading. This is because Google Analytics lumps traffic in buckets without a quick and easy way to see the “why” behind each visitor. Sure, you can sort by organic traffic, but that isn’t going to tell the whole story; you need to get a look at the intent behind each visit to truly understand how your SEO strategy impacts your traffic. That is exactly what I’m going to teach you how to do with Google Search Console today.
The Issue at Hand: Missing Context
When I explained the relationship between various marketing analysis tools last month, I used the example of branded traffic as a sticking point. If you saw an uptick in organic traffic after putting out a new commercial, who’s to say that traffic isn’t coming from consumers searching your name after seeing it? Google Analytics doesn’t give you those details, making it impossible to truly discern what has led to this increase. This same issue comes up when talking about transactional and informational traffic.
Transactional traffic comes from users who are searching with the intent to purchase a vehicle. Searches that are transactional in nature include keywords like “Ford dealer” and “Chevy Silverado for sale.” Informational traffic comes from keywords like “Ram 1500 towing capacity.” This comes from users who are performing research and those who want to learn more about something. Since the latter won’t increase your sales, research-focused terms are unlikely to be keyword targets in a successful SEO strategy. Unfortunately, though, informational traffic can make it look like good progress is being made; it’s a detail that can often be overlooked due to the broad data buckets in Google Analytics.
With all of that said, it’s time to look behind the curtain and see the real data; how is your SEO strategy really impacting traffic to your website?
Refining the Data With Search Console
As you know by now, the data in Google Analytics is generalized. But a secondary tool–Google Search Console–can help to refine the data so that you can get a better understanding of the traffic being pulled in by your SEO strategy.
First things first, head to Google Search Console and open “Search Results.”
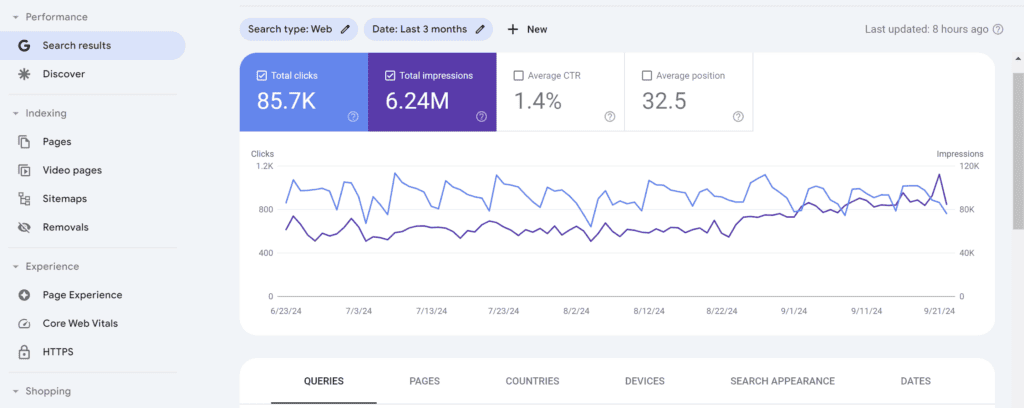
This section can look a bit overwhelming at first, but it’s actually quite simple (and super interesting)! At the top, you’ll see a graph that shows Impressions (times your site was visible during a search), Clicks (those who clicked to your website), Average CTR (ratio between impressions and clicks), and Average Position (the average position your website was in based on all of the searches it was served). You can change the date range here to see the time period you want.
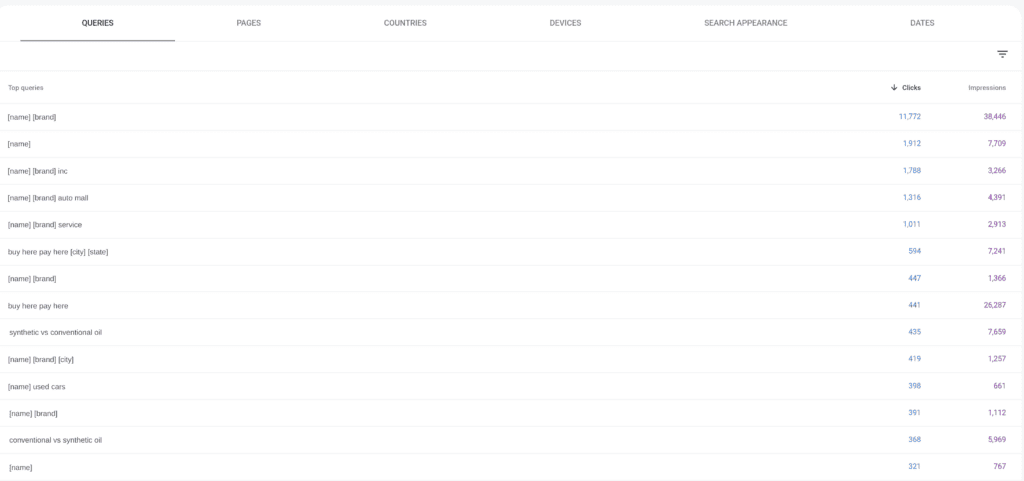
Below the graph, you’ll see some of the real nitty gritty.
First, there are Queries (keywords) along with their Clicks and Impressions.
Then, Pages (pages served to users during search) along with their Clicks and Impressions.
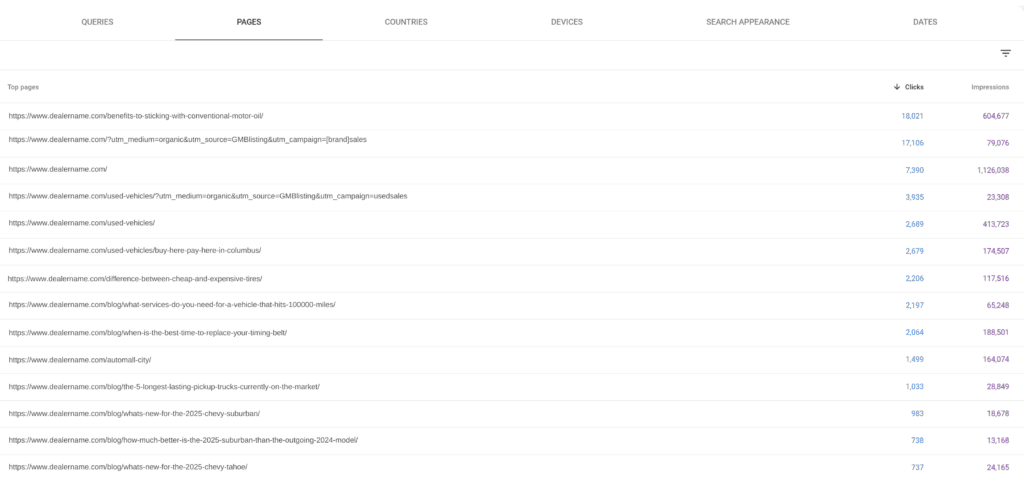
Both of these pieces of information are crucial to understanding where your traffic comes from, the intent behind the visits to your site, and whether or not your SEO strategy is impacting traffic. Is a keyword you’ve recently targeted seeing an increase in Impressions and Clicks? Is the page you worked on seeing an increase in Impressions and Clicks? Do these numbers coincide with the general increase in organic traffic you’ve seen in Google Analytics? There you have it; your SEO strategy is making moves!
Looking at your data this way is a great gut check for your specific targets. It’s also a fantastic way to gauge overall strategy performance and value. Say there were 1,000 clicks to your website in the last 30 days, and this was up from 500 the month before. But wait… you haven’t sold any more cars or even had more calls. You look closer and…BOOM! 250 of the additional clicks were from informational searches that led users to your blog about how to do an oil change, 200 were from searches for your dealership’s name the days after you launched a new TV commercial, and only 50 of those additional clicks were from transactional non-branded searches.
So, 50% of those clicks aren’t likely to get you a sale and 40% can be attributed to your commercial. This means that only 10% can be attributed to your SEO strategy. While it is helping you grow, the initial 500 click increase was misleading. That’s why it’s essential to use Google Search Console to gut-check the traffic increases you see in Google Analytics and to learn more in general about what is leading users to your site.
Data Dives Are Essential to Measuring Success
Google Search Console is a powerful tool that can help you more deeply understand those who are visiting your site and analyze the data you see in Google Analytics. I urge you to walk through the steps I’ve outlined above by spot checking some important terms to your dealership and seeing where any recent increases in traffic are coming from. Are you ranking for those important terms? Are you paying for an SEO service and it seems like your only increases are coming from informational searches?
These are all important questions that you deserve to know the answers to. So, take a dive into your data using Google Search Console and contact us at Wikimotive if you have any questions about what you see. We are always happy to help dealers understand how they perform and how they could be performing.