
Last week, we provided an overview of Facebook Page Insights, a great front-end tool that helps you to monitor the effectiveness of your posting strategy. Now, there are more in-depth tools and visibility provided by both Facebook Business Manager and other third-party tools, but the simplified accessibility of Page Insights makes it universally valuable. This week, we’ll be exploring Facebook Audience Insights. So, if you want a better understanding of both the social media audience that you have – and the social media audience that you want – we have ‘Just the Tip’ for you.
Facebook traffic. Everyone wants to increase their share of it, in the hopes of generating more leads and sales opportunities. It’s why we create content in the first place, and it’s why Facebook Insights are so valuable, and some of the most valuable analytics are the ones that help you to better understand your audience.
When Your Fans Are Online
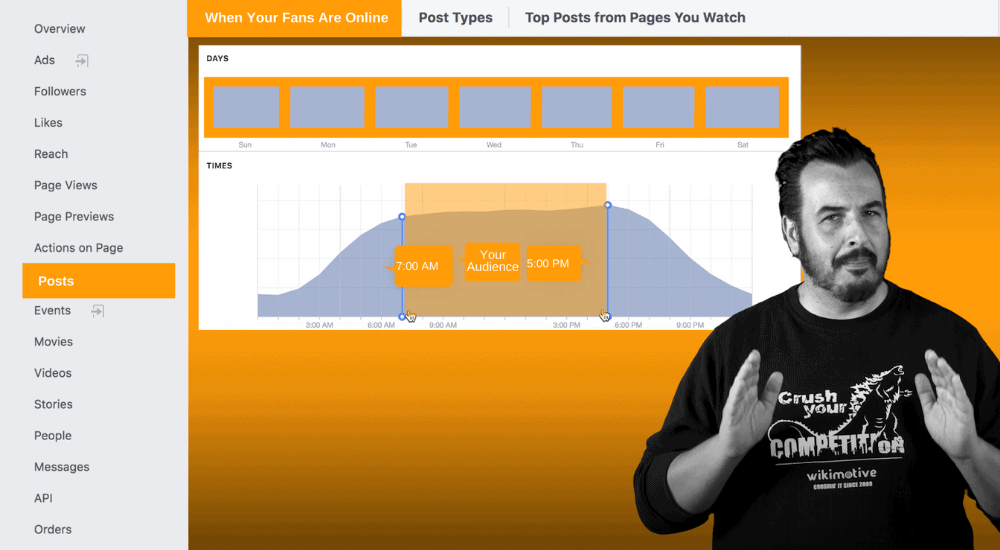
When looking to understand the audience that you have – one of the most valuable views that you have can be found under the ‘Posts’ section of the Insights tab. Titled ‘When Your Fans Are Online”, it provides a breakdown of your audience’s Facebook activity across a 7-day period along with a view of their activity across each 24-hour period. By clicking on each day, you can see the data specific to that day – or you can choose a composite view which averages the data from each of the seven days. The value of course, is that you can identify when your audience is most active on Facebook, helping you to optimize your posting scheduling and shape a more effective content strategy.
Post Types
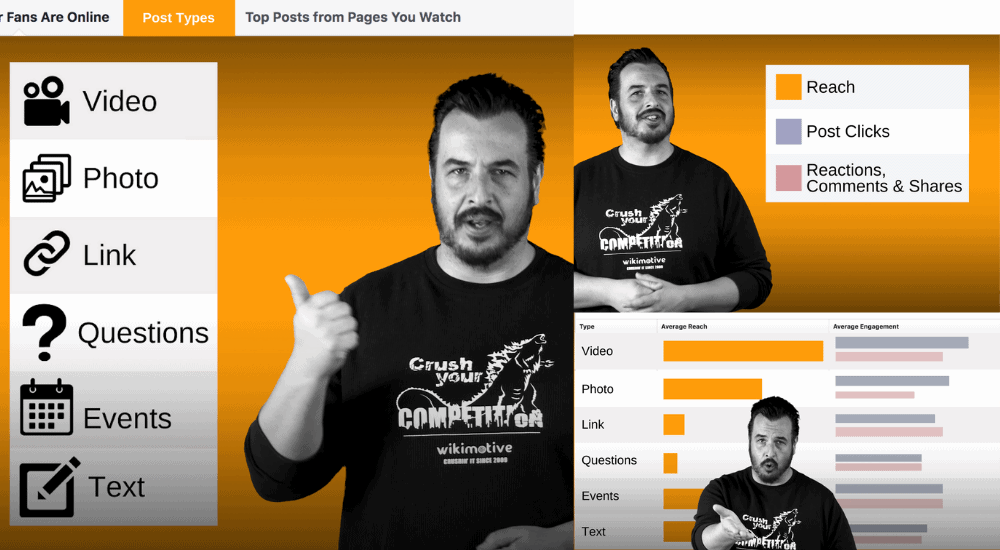
Similar value comes from the ‘Post Types’ tab. This offers an overview of the types of content you’re posting and averages both reach and engagement numbers to show how well they perform when compared with one another. There are six basic post types for Facebook: Video, Photo, Links, Questions, Events and, of course basic Text-Only Posts. Performance is gauged through three metrics: Reach, Post Clicks, and Reactions, Comments & Shares. Understanding which of these post types performs best with your audience, and how the audience engages with them, allows you to plan your content more effectively.
Top Posts from Pages You Watch
Those of you who joined us last week may remember our discussion of ‘Pages You Watch’, a feature that allows you to monitor the performance of your local competitors, or businesses whose social media activity is of interest to you. The ‘Top Posts from Pages You Watch’ is a related feature, but refines the view so that you can focus solely on their most popular content. Remember, to populate this feature you’ll need to visit the Overview Tab on the left of the page, scroll to the bottom of the page to add the Business Pages that you want to follow.
Your Fans

Knowing how many people follow your page is important, but it’s far more valuable to understand who those people are. Under the ‘People’ section of the Insights tab, you’ll find four tabs titled ’Your Fans’, ’Your Followers’, ’People Reached’, and ‘People Engaged’. Each of these breaks your audience down by gender, age and geography and can help you to identify the segments of your local audience who are and aren’t engaging with your dealership’s content. That said, let’s talk about each of those four views that are provided.
First, it’s important to understand the difference between ‘Your Fans’ and ‘Your Followers’. While ‘Followers’ defines those who actively follow your page, your ‘Fans’ can be anyone who has seen any of your posts – be it as a result of Facebook recommendations, or organically through the activity of their Facebook friends. ‘Fans’ represent potential ‘Followers’ and, in turn, potential new leads for your dealership. The same applies to ‘People Reached’ which is anyone who has seen any of your content, including any targeted ads. Finally, ’People Engaged’ present those who are interacting with your content, through reactions, comments and shares.
Not only does this data help to distinguish between the ‘audience you have’ and ‘the audience you want’ but it can help you in shaping your content strategy to better align with both. Ask yourself, how evenly is your dealership’s audience split between men and women? Which age demographics are you connecting with, and which are you not? Simple questions like that will help you to better understand the steps you could take to strategically tailor your content in the hopes of growing your audience.
So, there you have it – over the past two weeks, we’ve taken a closer look at two particularly valuable sections of your Facebook Insights. Take the time to explore Insights, and you’ll find plenty of useful analytics. In fact, why don’t we take this conversation full-circle next week – by exploring what Facebook analytics can tell you specifically about your Video Content, so be sure to join us next Thursday for that – and every Thursday for more SEO and Digital Marketing insights – right here – on ‘Just the Tip’.